- About
-
Solutions
-
Services
-
Biosciences
- PureDisc™ Enabled Membrane Protein Production
- Assay Development and Transfer
- Biochemistry / Enzymology
- Biomarker Services
- Biophysics
- Cellular Biology
- Compound screening and cascade design
- Cryo-EM
- Fibrosis Assays
- Project Management and Consultancy Services
- Protein Expression
- Structural Biology
- X-ray Crystallography
- Chemistry
- Integrated Drug Discovery
- Computer Aided Drug Design
- Hit ID and Screening Services
- DMPK Services
-
Biosciences
- Target Classes and Modalities
- Therapeutic Areas
-
A-Z
- A
- B
- C
- D
- E
- F
- G
- H
- I
- K
- L
- M
- N
- O
- P
- R
- S
- T
- V
- X
-
Services
- Library
- News & Events
- Careers
- PureDisc™
Experimental Polar Surface Area (EPSA) Assay
Topological polar surface area (TPSA) and Experimental Polar Surface Area (EPSA) are used to assess the permeability of compounds. They are an alternative to cell-based assays such as Caco-2 or MDCK permeability assays which usually work well for compounds within the rule of 5 space. However, for some compound classes, these assays are not suitable due to their physical/chemical properties such as solubility and non-specific binding.
TPSA can be determined using molecular property calculators. However, certain compound classes e.g. PROTACs® are prone to conformational changes e.g. via formation of intramolecular hydrogen bonds (IMHB’s) and often cause these calculators to give poor results. In those cases, EPSA may provide a more useful descriptor of the relative degree of polar surface area.
The EPSA assay is a valuable tool in drug discovery, particularly for assessing the ability of non-classical drug candidates, such as PROTACs® or cyclic peptides to permeate biological membranes. It has been demonstrated that for compounds with LogP < 1 and EPSA < 100, there is a strong correlation with good permeability1.
Moreover, to improve the predictability of blood brain barrier (BBB) permeability, one can combine EPSA with additional parameters such as LogD and polarisability.
In addition, the EPSA assay is relatively fast and cost-effective compared to more complex in vitro or in vivo methods, enabling high-throughput screening of compound libraries.
Experimental Procedure
The EPSA assay is based on the calculation of the polar surface area of a molecule using a supercritical fluid chromatography (SFC)-based method calibrated with a range of industry established reference standards. It is based upon the method described by Goetz et al.2
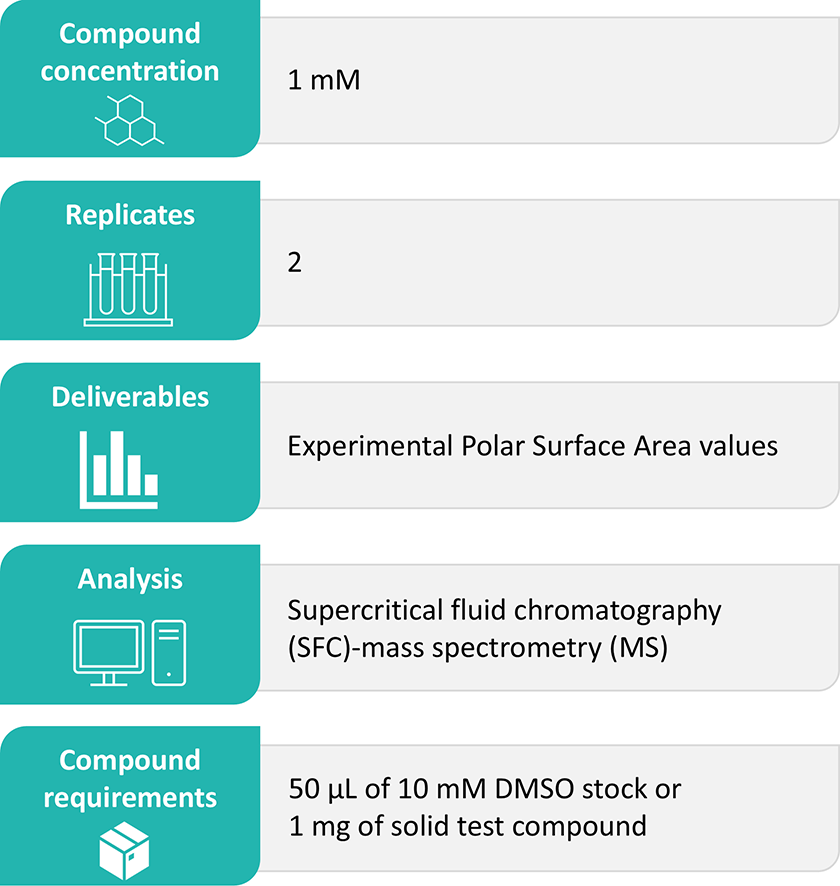
Samples are prepared in an appropriate solvent at approximately 1 mM and analysed by SFC using a Chirex 3014 (S)-Val (R)-NEA 50 x 4.6 mm column and 20 mM ammonium formate in methanol as the organic modifier. An industry established set of six reference compounds (antipyrine, chlorpromazine, pindolol, diclofenac, 3-nitrobenzoic acid, furosemide) are used to generate an appropriate EPSA calibration curve, as shown in Figure 1.
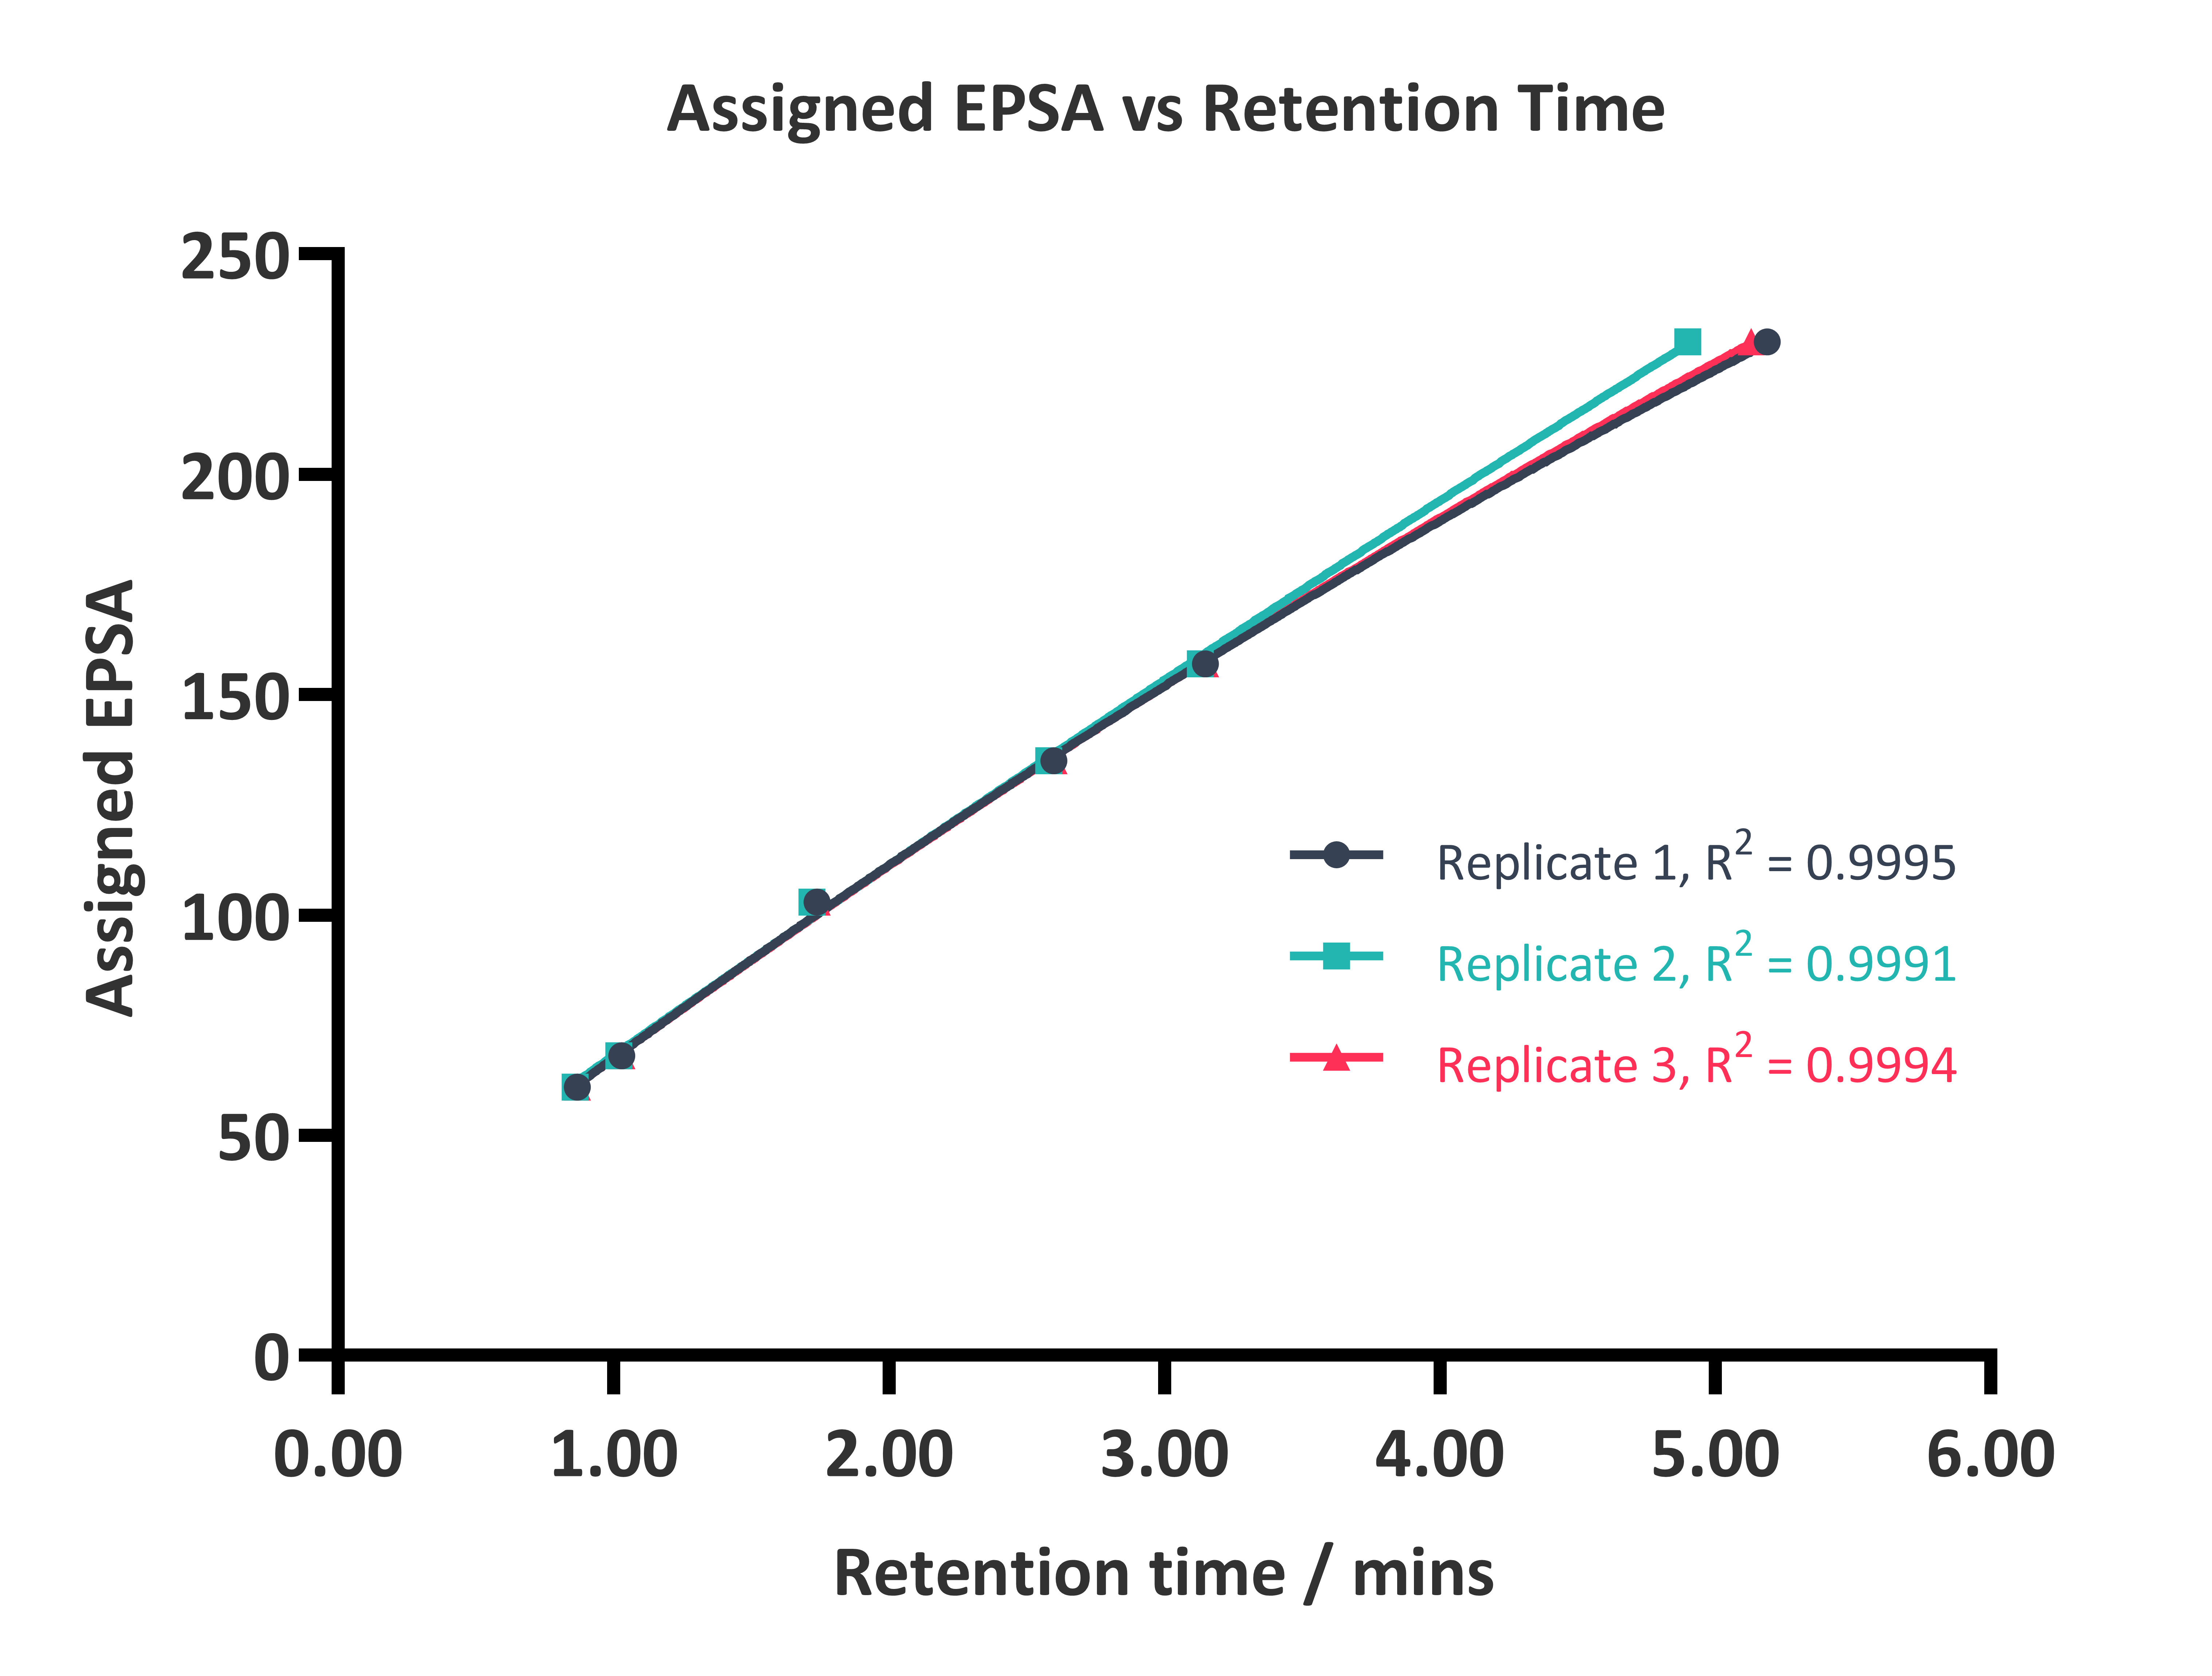
Figure 1: Calibration plots of the literature established standards acquired on 3 separate occasions.
Data Analysis
The retention times of test compounds are determined and their EPSA values calculated from the reference standard calibration plot.
Deliverables
The results are reported in Excel file format as calculated EPSA values. Any relevant comments about compound stability/solubility are also included in the report.
Turnaround time from receipt of the test compounds to release of data is typically 2 weeks.
(PROTAC® is a registered trademark of Arvinas Operations, Inc., and is used under license)
References:
- G. H. Goetz, M. Shalaeva, G. Caron, G. Ermondi and L. Philippe, Mol. Pharmaceutics, 2017, 14, 386-393.
- G. H. Goetz, L. Philippe and M. J. Shapiro, ACS Med. Chem. Lett., 2014, 5, 1167-1172.
Start your next project with Domainex
Contact one of our experts today